
High-Level Dashboard & Key Metrics
The High-Level Dashboard (accessible via the Overview tab) serves as the executive summary and health control center for your test suite execution. It transforms thousands of raw assertion points into clear, actionable KPI indicators.
📊 Overview Tab Components
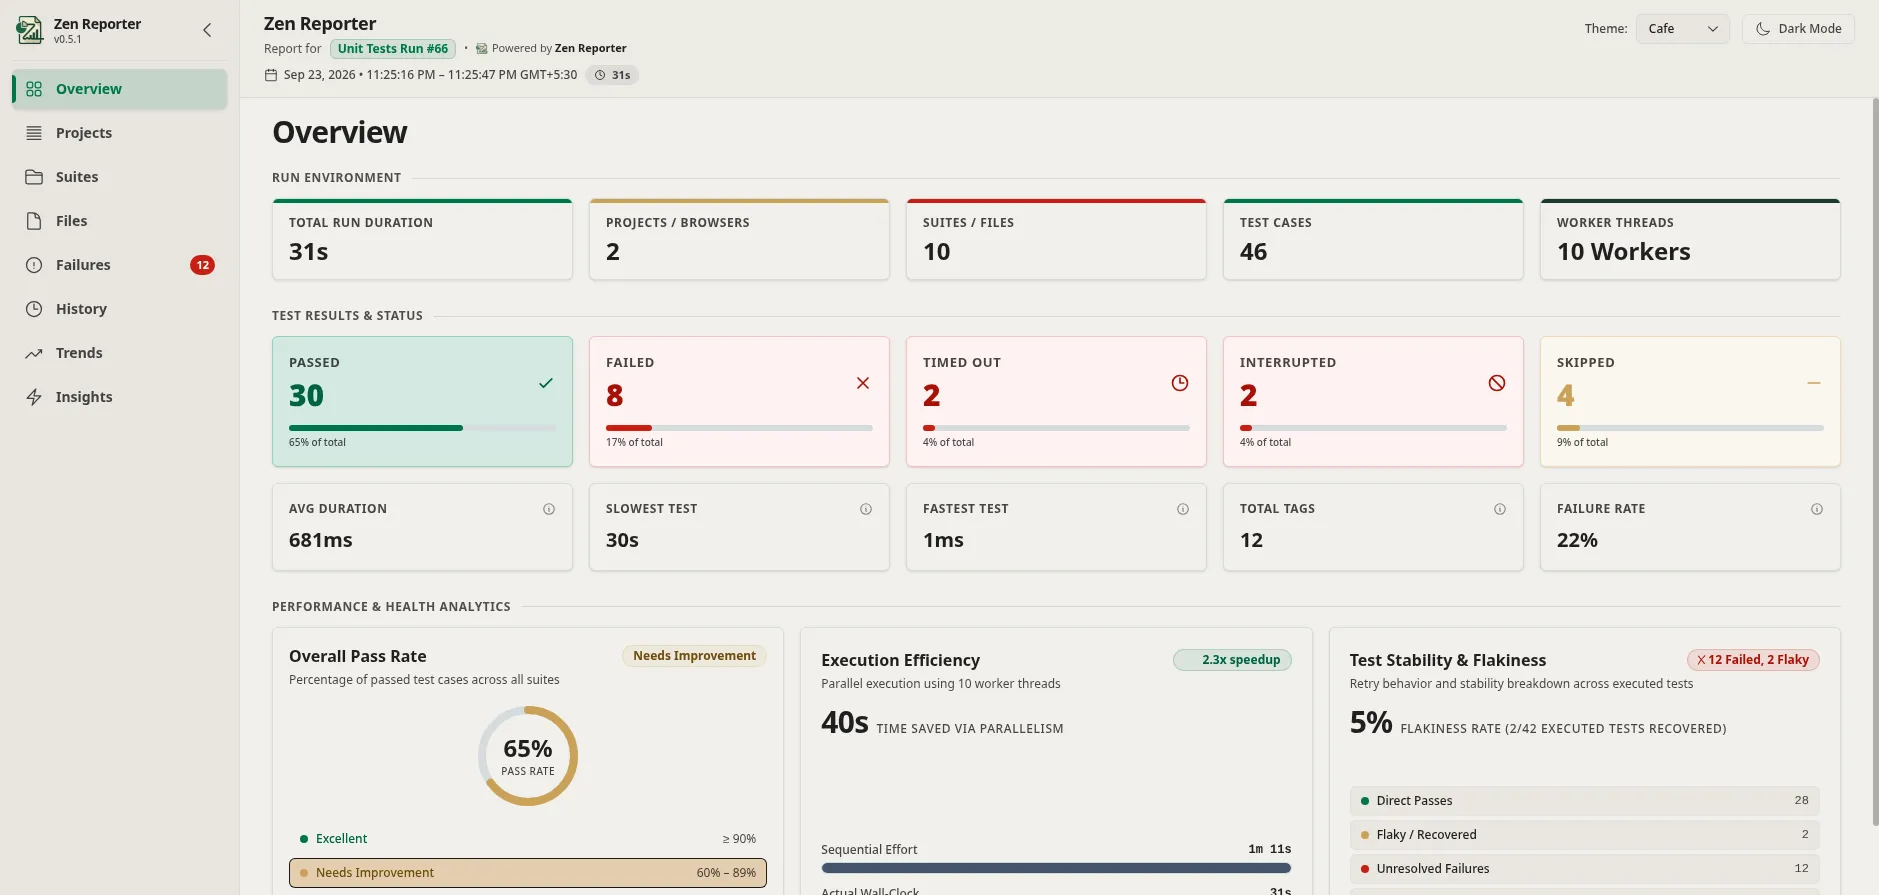
Section titled “📊 Overview Tab Components”┌──────────────────────────────────────────────────────────────────────────────────────────┐│ Dashboard Overview │├──────────────────────────────────────────────────────────────────────────────────────────┤│ Run Metadata Info Cards ││ Run Duration, Total Projects, Total Suites, Total Tests, Worker Threads │├──────────────────────────────────────────────────────────────────────────────────────────┤│ Quick KPI Stats ││ (Total, Pass, Fail, Skipped, Interrupted) │├──────────────────────────────────────────────────────────────────────────────────────────┤│ Quick KPI Stats ││ (Avg. Duration, Slowest Test Duration, Fastest Test Duration, Total Tags, Failure Rate) │├──────────────────────┬───────────────────────────────┬───────────────────────────────────┤│ Pass Rate Ring │ Execution Efficiency Card │ Test Health Breakdown ││ (Radial %) │ Wall-Clock Duration │ (Passed, Failed, TimedOut, ││ │ vs. │ Skipped, Interrupted bar) ││ │ Cumulative Sequential │ ││ │ Worker Duration │ │└──────────────────────┴───────────────────────────────┴───────────────────────────────────┘🔍 Key Dashboard Features & Metrics
Section titled “🔍 Key Dashboard Features & Metrics”1. Run Information Cards
Section titled “1. Run Information Cards”Provides environment context for compliance and audit logs:
- Execution Duration: Actual wall-clock duration taken for the latest test run.
- Projects/Browsers: Total number of project/browser profiles configured for the project.
- Suits/Files: Total number of spec files or
describesuites in the project. - Test Cases: Total number of test cases evaluated across all Playwright project configurations.
- Worker Thread Count: Number of Playwright worker threads utilized during execution.
2. Quick KPI Stat Counters
Section titled “2. Quick KPI Stat Counters”A horizontal bar of cards summarizing execution numbers and timing benchmarks:
- Passed: Count of successfully verified test cases.
- Failed: Count of test cases failing Playwright assertions or throwing unhandled execution exceptions.
- Timed Out: Count of test cases exceeding configured execution timeouts (
test.setTimeout()). - Interrupted: Count of test cases abruptly terminated due to process crashes, worker terminations, or SIGKILL/SIGINT signals.
- Skipped: Count of conditionally bypassed or explicitly skipped test cases (
test.skip()). - Avg Duration: Average execution duration across all test cases (e.g.,
655ms). - Slowest Test: Duration of the single slowest test case in the execution run (e.g.,
30s). - Fastest Test: Duration of the fastest completed test case (e.g.,
1ms). - Total Tags: Total count of unique
@tagidentifiers used across test titles and suites (e.g.,12). - Failure Rate: Percentage proportion of failed test cases relative to total evaluated tests (e.g.,
17%).
3. Radial Pass Rate Ring
Section titled “3. Radial Pass Rate Ring”-
Visual Design: Large circular radial progress indicator with dynamic WCAG color coding:
- 🟢 Green (>= 90%): High suite stability.
- 🟡 Yellow (70% - 89%): Moderate failure rates requiring attention.
- 🔴 Red (< 70%): Critical execution failure state.
-
Center Metric: Large bold percentage value indicating the exact pass rate calculated as:
Pass Rate (%) =
(Passed Test Cases / (Total Test Cases - Skipped Test Cases)) × 100
4. Execution Efficiency Card
Section titled “4. Execution Efficiency Card”Measures test execution speedup gained through Playwright parallel worker threads:
-
Wall-Clock Duration: Total real time elapsed from test run start to final completion.
-
Total Sequential Duration: Cumulative sum of individual test execution times if run sequentially on a single thread.
-
Efficiency Speedup Multiplier: Calculated as:
Speedup Factor =
Total Sequential Duration / Wall-Clock Duration -
Worker Utilization Insight: Demonstrates how effectively parallel worker threads reduced CI build duration.
5. Test Stability & Flakiness Card
Section titled “5. Test Stability & Flakiness Card”Provides a retry behavior and stability breakdown across executed tests:
- Flakiness Rate Metric: Prominent percentage indicator highlighting recovered test cases relative to total executed tests:
Flakiness Rate (%) =
(Flaky / Recovered Tests / Total Executed Tests) × 100(e.g.,5%-2/44 EXECUTED TESTS RECOVERED). - Anomalies Pill Badge: Header badge summarizing failing and flaky tests (e.g.,
✕ 10 Failed, 2 Flaky). - Category Breakdown List:
- 🟢 Direct Passes: Count of tests passing on the initial attempt (e.g.,
32). - 🟡 Flaky / Recovered: Count of tests that failed initially but passed upon retry (e.g.,
2). - 🔴 Unresolved Failures: Count of tests remaining failed after all retry attempts (e.g.,
10). - ⚪ Skipped (Unexecuted): Count of bypassed or unexecuted test cases (e.g.,
4).
- 🟢 Direct Passes: Count of tests passing on the initial attempt (e.g.,
💡 How to Use the Dashboard
Section titled “💡 How to Use the Dashboard”- Daily CI Monitoring: Check the Pass Rate Ring and Quick Stats to immediately determine build status.
- Performance Benchmarking: Check Execution Efficiency Card after adjusting Playwright
workerscount inplaywright.config.tsto optimize parallel execution speeds. - Audit Trails: Capture screenshot of the Overview tab or generate
summary.htmlfor release readiness documentation.