
Execution History & Archiving
Tracking test suite health over time is essential for identifying degradation before releases. Zen Reporter automatically logs execution runs to JSONL archives and provides interactive historical views: History, File History, and Test History.
📦 JSONL Archive Mechanism
Section titled “📦 JSONL Archive Mechanism”When history archiving is enabled (enableHistory: 'auto' or true), Zen Reporter writes a lightweight .jsonl record for every test run to:
<outputDir>/runs/<run_id>.jsonlJSONL Schema Structure
Section titled “JSONL Schema Structure”Each line in a run JSONL file records flattened execution attributes:
run_id: Unique timestamped run identifier.started_at: ISO timestamp of execution start.suite: Testdescribehierarchy string.file: Relative spec file path.title: Test case title.project: Playwright project profile name.duration_ms: Execution time in milliseconds.status: Result (passed,failed,timedOut,skipped,interrupted).attempts: Number of retry attempts executed.
📊 History Tab Views
Section titled “📊 History Tab Views”The History tab in the report UI offers three sub-views:
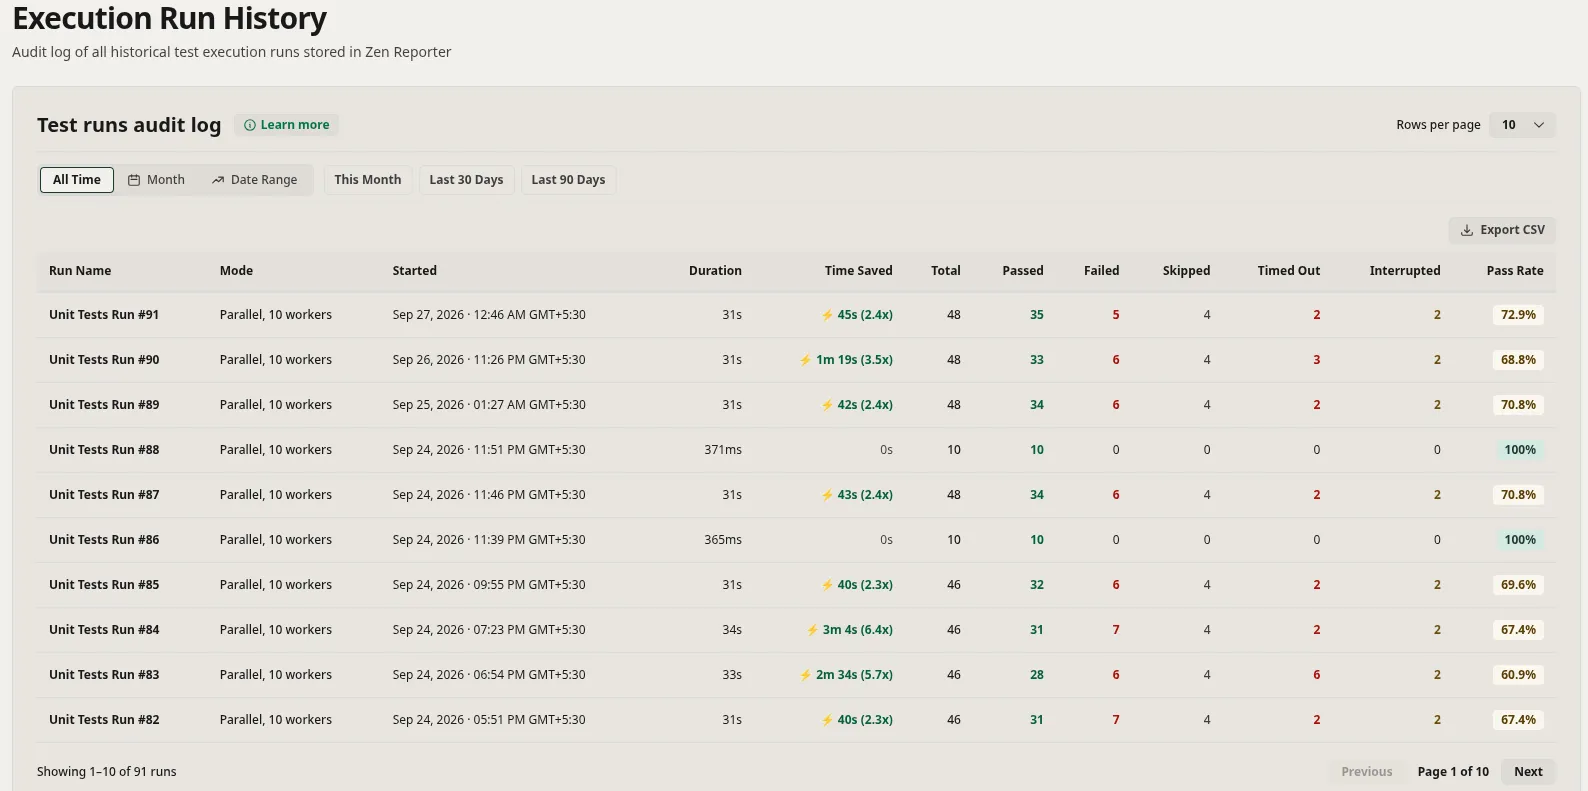
1. Historical Runs View
Section titled “1. Historical Runs View”Lists past test execution runs in reverse chronological order:
- Run Metadata: Run name, date/time, total duration, worker counts.
- Pass/Fail Breakdown: Pass rate percentage, total tests, passed count, failed count, skipped count.
- Quality Rating Badges: Automatically assigns automated health ratings:
- 🟢 Excellent: Pass rate ≥ 95%
- 🟡 Needs improvement: Pass rate between 80% and 94%
- 🔴 Critical: Pass rate < 80%
- Date-Range Filtering: Filter historical records using interactive date picker controls
2. File History View
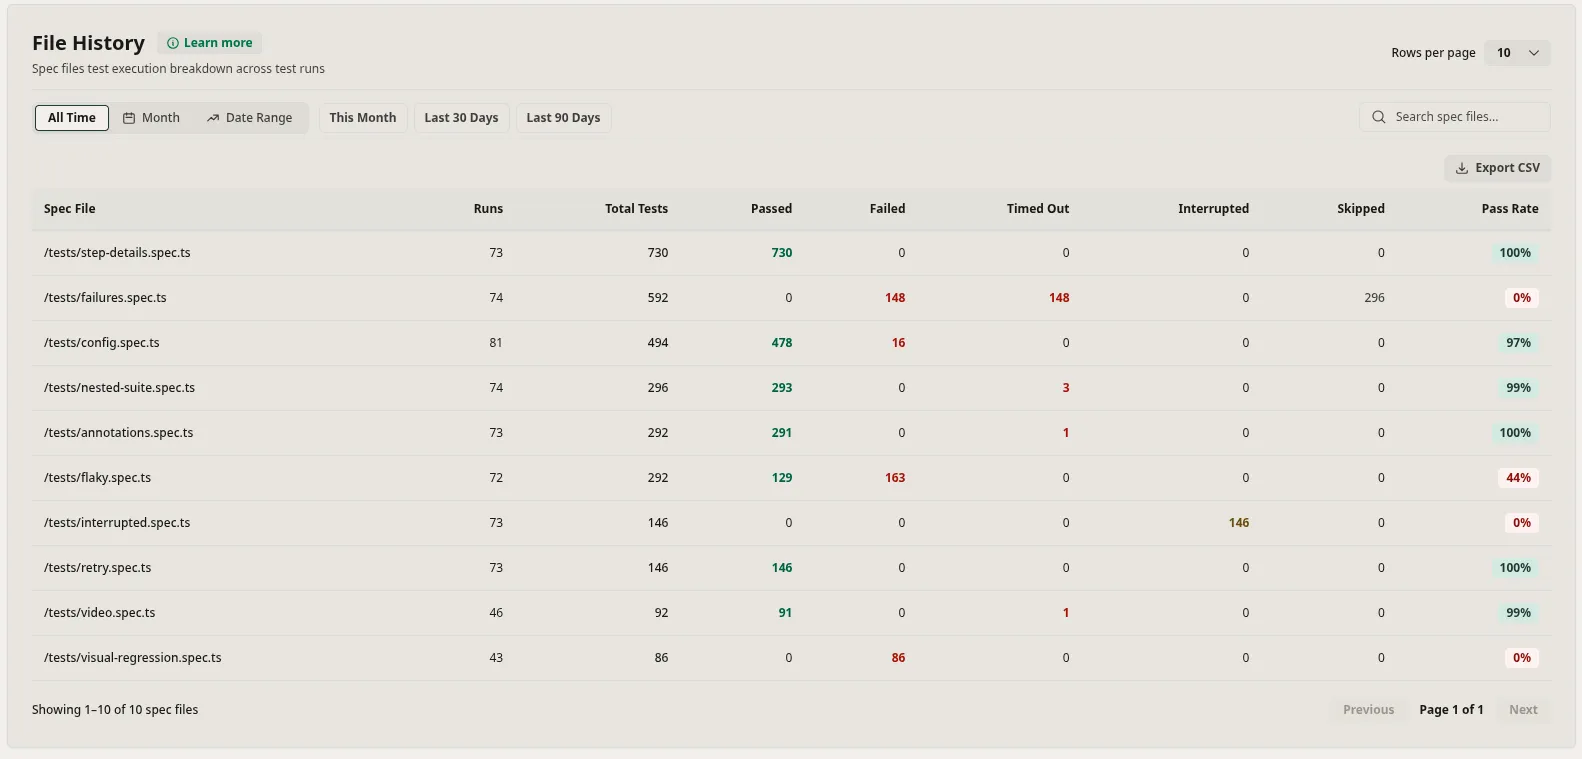
Section titled “2. File History View”Aggregates historical performance at the spec file level over time:
- Long-Term Spec Stability: Track historical pass rate trends for specific spec files.
- Execution Counts: Monitor how frequently spec files were executed.
- Date-Range Filtering: Filter historical records using interactive date picker controls
- Text Search: Instantly filter spec files by filename or path substring.
3. Test History View
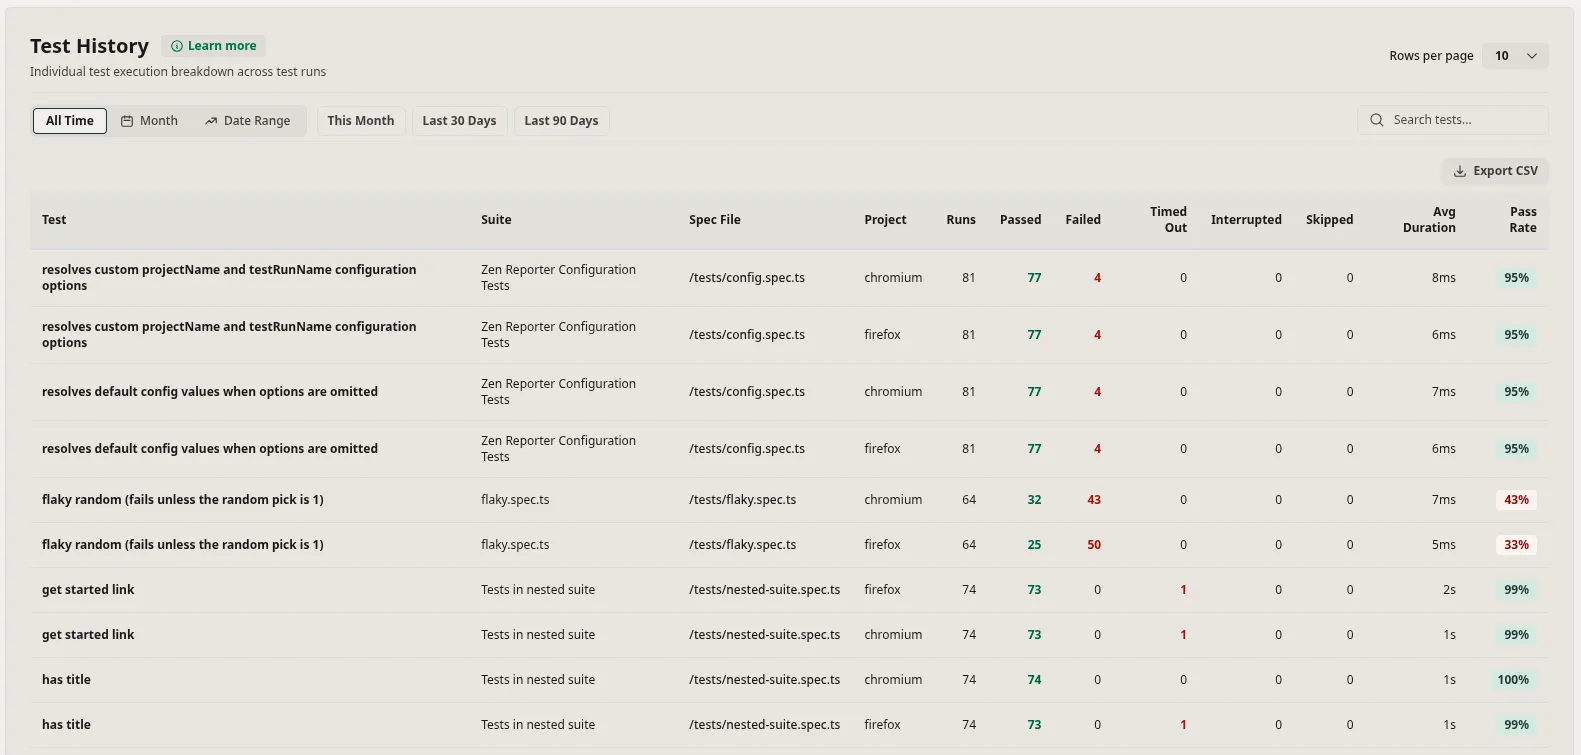
Section titled “3. Test History View”Provides granular historical tracking for individual test cases:
- Individual Pass/Fail Rates: See how many times a specific test case passed or failed across all archived runs.
- Average Duration Analysis: Identifies tests whose execution duration is gradually increasing over time.
- Date-Range Filtering: Filter historical records using interactive date picker controls
- Text Search: Search by visible columns (Test Title, Suite, Spec File, and Project).
📈 Trends View & Charts
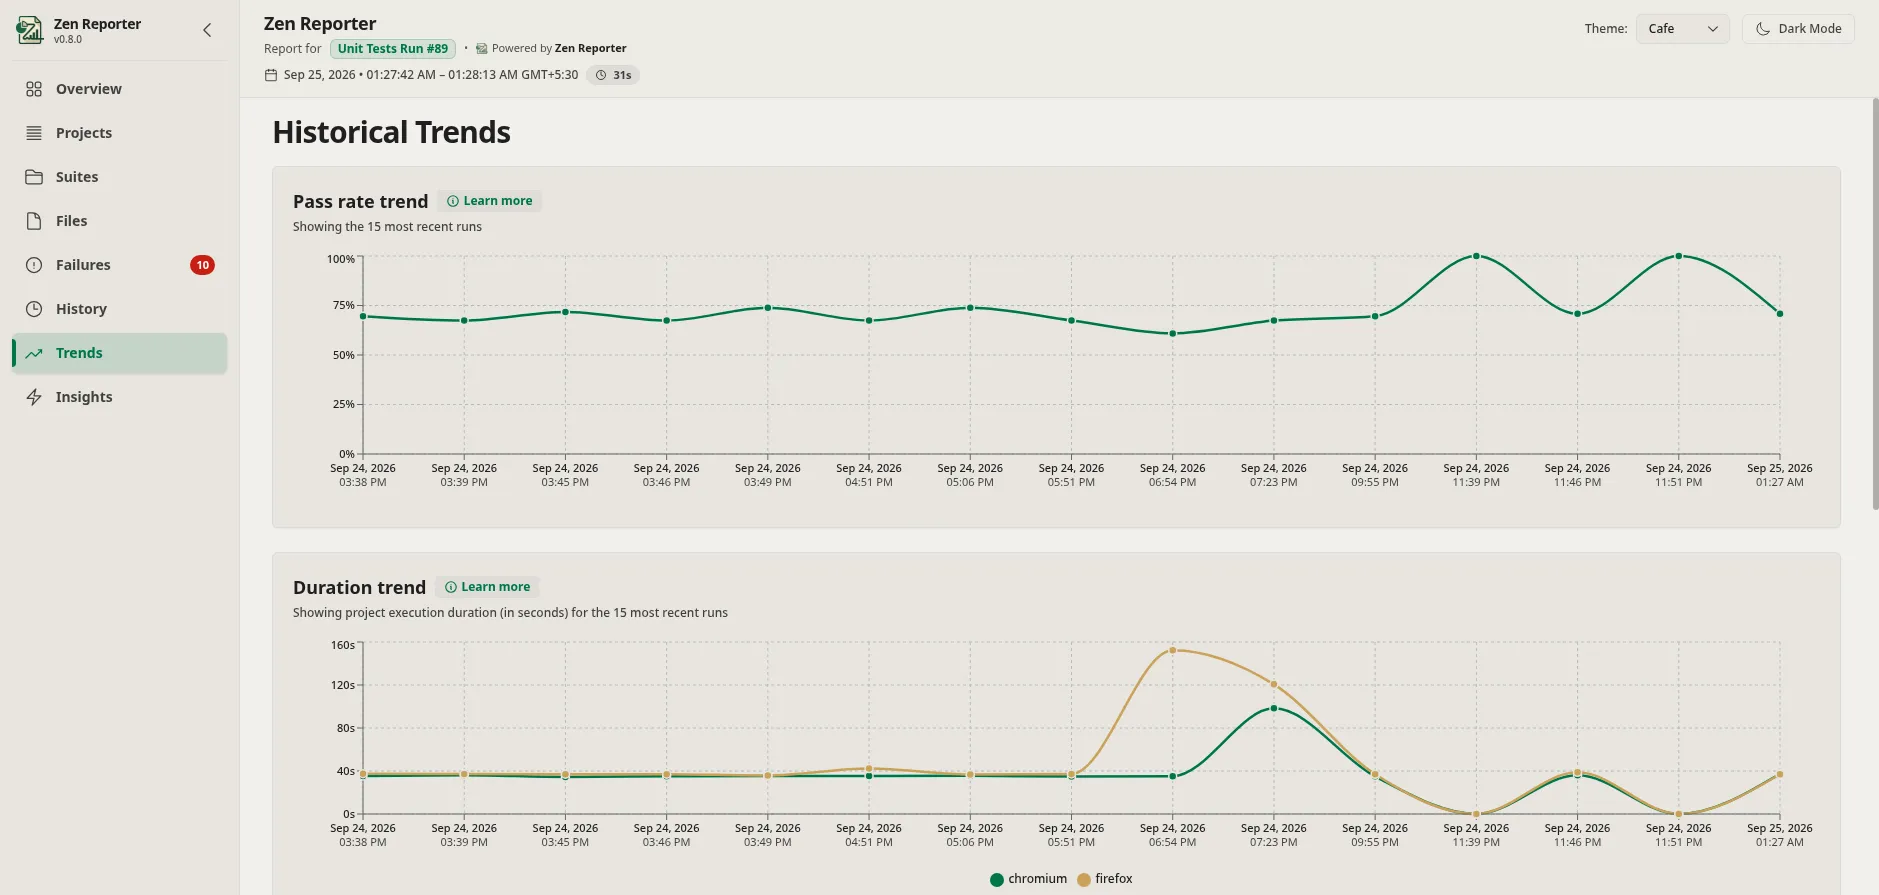
Section titled “📈 Trends View & Charts”The Trends tab in report UI visualizes long-term quality, performance, and test composition metrics across multiple historical runs using interactive Recharts visualization:
-
Pass Rate Trend Chart:
- Pass Rate Percentage: Interactive line chart rendering historical pass rate percentages across the 15 most recent runs.
- Interactive Run Hover Tooltips: Inspect exact pass rates for any historical run on hover.
-
Duration & Worker Efficiency Trend:
- Project Breakdown Bars: Line chart visualization detailing execution wall-clock time spent in each Playwright project profile (e.g.
chromium,firefox,webkit). - Worker Efficiency Trend: Track execution speedup gains and parallel worker thread performance over time.
- Project Breakdown Bars: Line chart visualization detailing execution wall-clock time spent in each Playwright project profile (e.g.
-
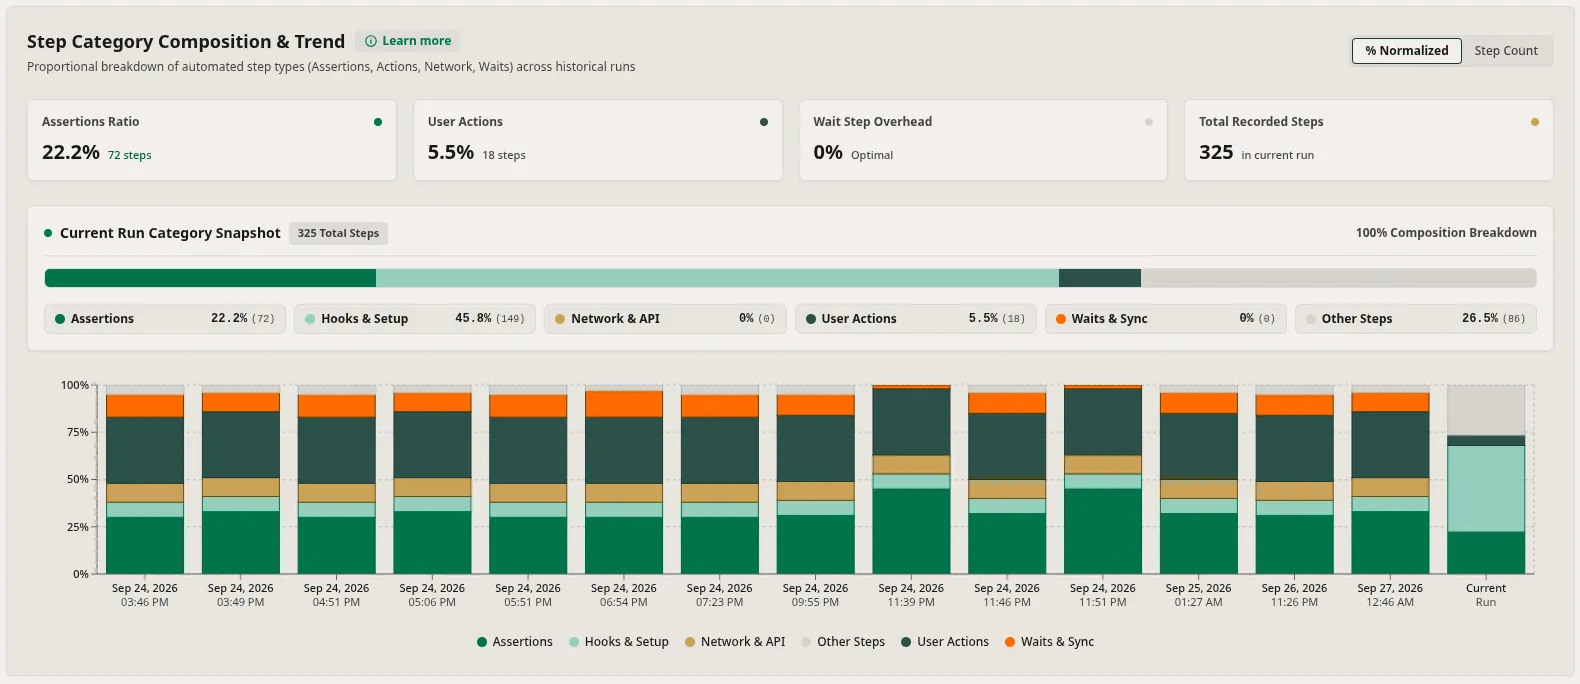
Step Category Composition:
- Execution Time Distribution: Visualizes breakdown of time spent in different Playwright test step categories (e.g.
hook,fixture,test.step,expectassertion,pw:api). - Current vs. Historical Averages: Compares current run step distribution against historical benchmarks to detect assertion or setup/teardown regressions.
- Execution Time Distribution: Visualizes breakdown of time spent in different Playwright test step categories (e.g.
💡 Managing History Archives
Section titled “💡 Managing History Archives”Rebuilding History Analytics (zr history report)
Section titled “Rebuilding History Analytics (zr history report)”If you add or modify .jsonl files in <outputDir>/runs/, re-run the CLI aggregator command to update history.json and inject updated metrics into index.html:
npx zr history reportDisabling History
Section titled “Disabling History”For single-run disposable CI environments, disable history archiving by setting enableHistory: false or minimalReport: true in your Playwright config.