Deep-Dive Failure Analysis
When test runs fail, identifying root causes quickly is critical. Zen Reporter’s Failures tab provides an advanced error diagnostic engine featuring error signature clustering, step-by-step trace step execution, source code syntax highlighting, and retry attempt inspection.
🔍 Failure Grouping Modes
Section titled “🔍 Failure Grouping Modes”At the top of the Failures tab, users can toggle between two intelligent failure grouping modes:
[ Group by File ] vs. [ Cluster by Error Signature (Shared Issues) ]1. Group by File
Section titled “1. Group by File”Organizes test failures by their parent spec file path. Ideal when debugging a broken spec file locally.
2. Cluster by Error Signature (Shared Issue Clusters)
Section titled “2. Cluster by Error Signature (Shared Issue Clusters)”Analyzes stack trace messages and error locations across all failed tests to cluster failures sharing identical root causes.
- Problem Solved: If an authentication API goes down, 50 different test cases across 10 spec files might fail with
Error: 500 Internal Server Error at /api/login. - Zen Reporter Solution: Groups all 50 failures into a single Shared Issue Cluster. QA engineers analyze and document 1 root cause instead of triage 50 individual items.
🛠️ Granular Failure Inspection Tools
Section titled “🛠️ Granular Failure Inspection Tools”Clicking on any failed test case opens the comprehensive diagnostic details:
┌────────────────────────────────────────────────────────────────────────┐│ 🔴 test("User checkout completes") - Attempt #2 (Failed) │├────────────────────────────────────────────────────────────────────────┤│ [ Run 1 (Failed) ] [ Run 2 - Retry #1 (Failed) ] │├────────────────────────────────────────────────────────────────────────┤│ Step-by-Step Execution Trace ││ ✅ 1. Navigate to /cart (230ms) ││ ✅ 2. Fill credit card details (450ms) ││ ▶ 🔴 3. Click #checkout-btn (5000ms - FAILED) │├────────────────────────────────────────────────────────────────────────┤│ Error Stack Trace & Syntax Highlighted Code Frame ││ > 42 | await page.locator('#checkout-btn').click(); ││ 43 | await expect(page.locator('.success')).toBeVisible(); ││ ^ Error: Timed out 5000ms waiting for expect(locator)... │├────────────────────────────────────────────────────────────────────────┤│ Diff Stack Trace Comparison ││ Expected: "Order Confirmed" ││ Received: "Payment Processing Error" │├────────────────────────────────────────────────────────────────────────┤│ Attachments & Logs ││ [ 📷 trace-screenshot.png ] [ 🎥 video.webm ] [ 📄 trace.zip ] │└────────────────────────────────────────────────────────────────────────┘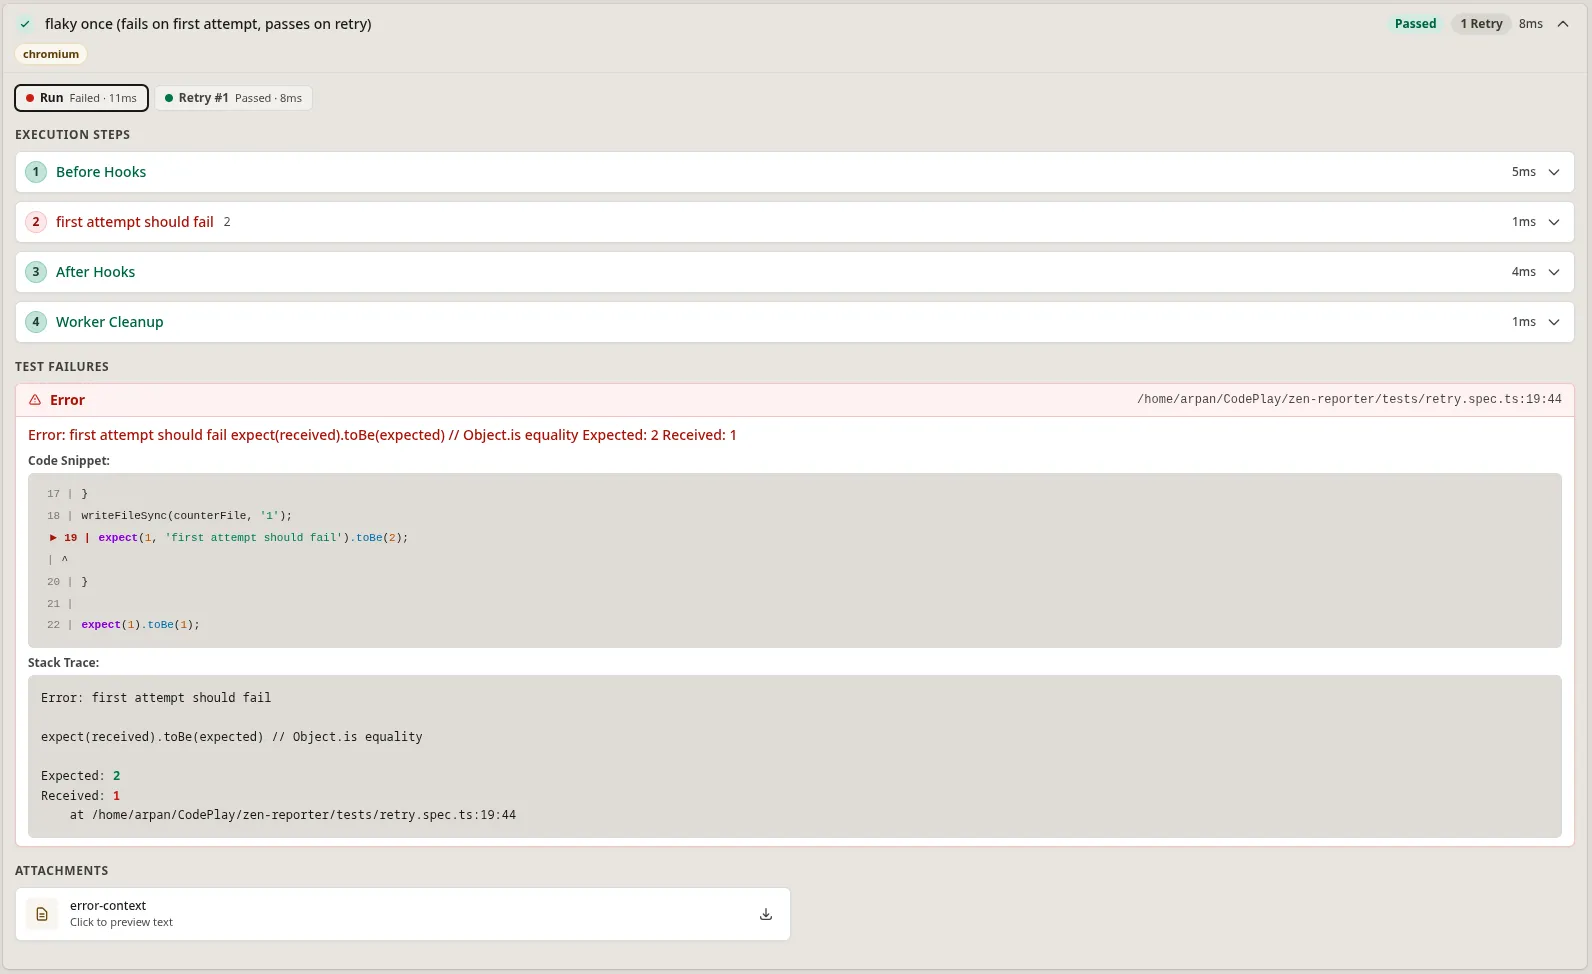
🔍 Key Diagnostic Capabilities
Section titled “🔍 Key Diagnostic Capabilities”1. Target Step Indicator (▶)
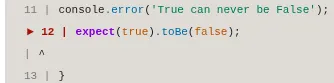
Section titled “1. Target Step Indicator (▶)”In the step-by-step execution trace, Zen Reporter pinpoints the exact line where Playwright execution aborted with a prominent target arrow indicator (▶). No more scrolling through numerous passed steps to find the assertion failure.
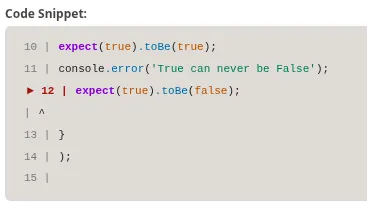
2. Syntax-Highlighted Code Frame Snippets
Section titled “2. Syntax-Highlighted Code Frame Snippets”Extracts source code lines directly from Playwright test files and renders inline syntax highlighting with context lines surrounding the failed assertion line.
3. Structured Diff Stack Trace (Expected vs. Received)
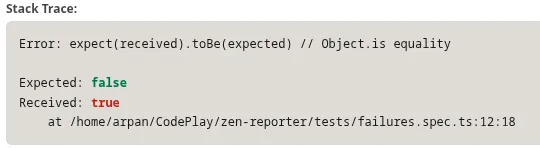
Section titled “3. Structured Diff Stack Trace (Expected vs. Received)”For Playwright expect() value assertion mismatches, Zen Reporter formats visual color-coded text diffs highlighting exact string or JSON object discrepancies:
- 🟢 Expected: Expected object structure or baseline text.
- 🔴 Received: Actual runtime output returned by the application under test.
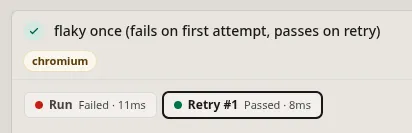
4. Retry Attempt Inspection Tabs (Run, Retry #1, Retry #2)
Section titled “4. Retry Attempt Inspection Tabs (Run, Retry #1, Retry #2)”When Playwright retries flaky tests (retries: 2 in playwright.config.ts), Zen Reporter creates dedicated tab panels for each execution attempt. Users can inspect trace steps, console logs, and screenshots for both the initial failing attempt and subsequent retries, in a single place.
5. Attachments & Artifact Integration
Section titled “5. Attachments & Artifact Integration”Direct access to Playwright test artifacts:
- Text Artifacts: Inline previews for text file artifacts.
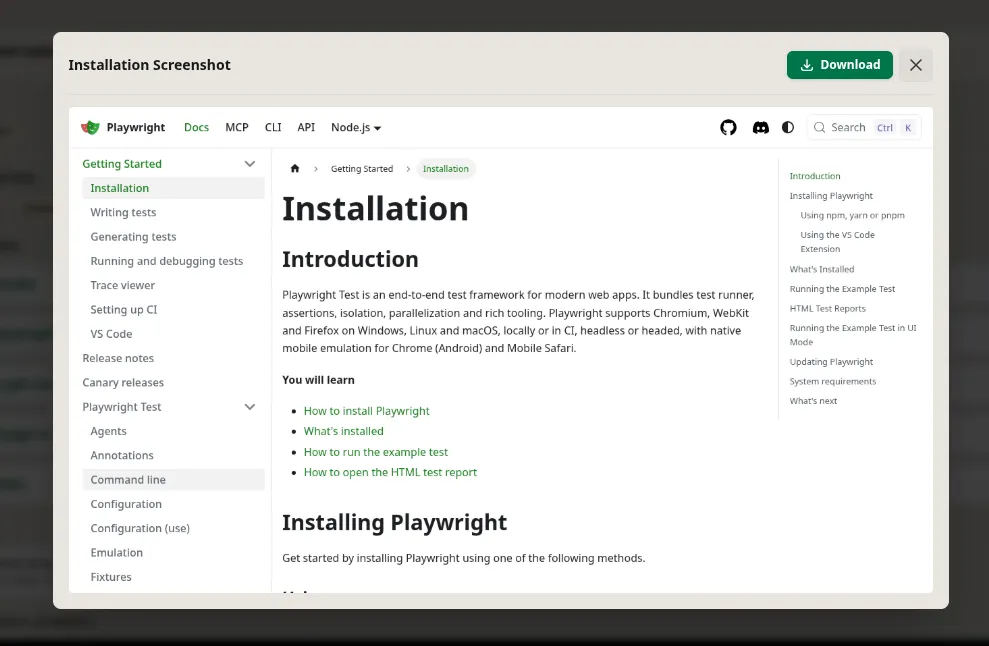
- Screenshots: Inline image previews for failure snapshots.
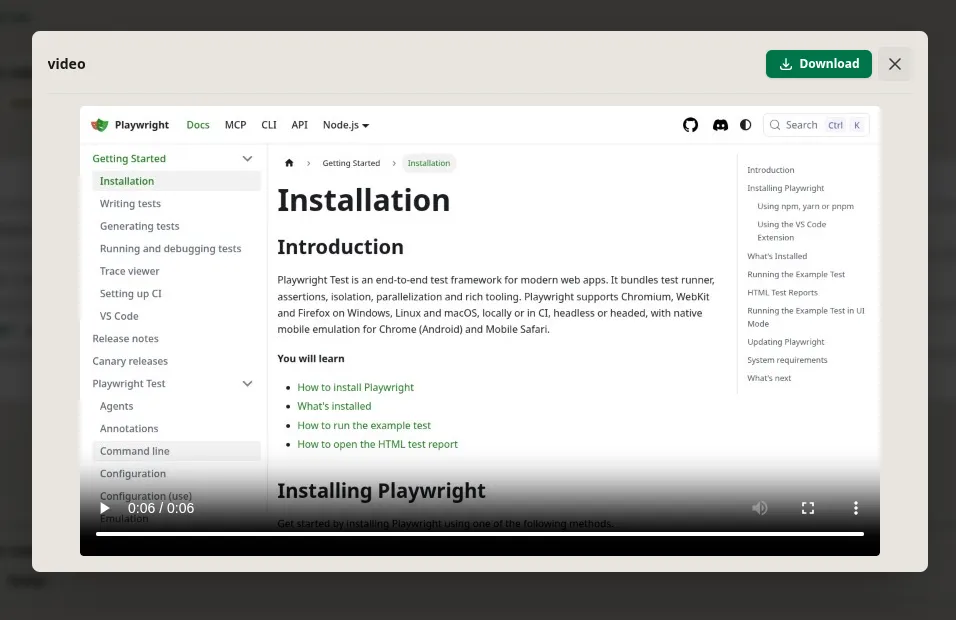
- Videos: Built-in video player for test execution recordings (
video: 'retain-on-failure'). - Trace Viewer Downloads: One-click direct link to Playwright trace files (
trace: 'retain-on-failure').