
DuckDB-Powered Test Intelligence & CLI
Zen Reporter features an embedded analytics engine powered by DuckDB (@duckdb/node-api). By querying historical JSONL run logs, DuckDB delivers instant insights into test suite stability, flakiness, and performance regressions directly from your terminal or UI dashboard.
⚡ DuckDB Analytics Engine Overview
Section titled “⚡ DuckDB Analytics Engine Overview”flowchart LR
A["Historical JSONL Logs (<outputDir>/runs/*.jsonl)"] --> B["DuckDB Node API"]
B --> C1["Flaky Intelligence Engine"]
B --> C2["Regression Tracker"]
B --> C3["P95 / Latency Calculator"]
B --> C4["Custom SQL Query Engine"]
C1 & C2 & C3 --> D["UI Insights Tab & CLI Reports"]
C4 --> E["Terminal SQL Output"]
📊 Analytical Intelligence Modules
Section titled “📊 Analytical Intelligence Modules”1. Flaky Test Intelligence (npx zr history flaky)
Section titled “1. Flaky Test Intelligence (npx zr history flaky)”Detects test cases that alternate between passing and failing across historical test runs.
-
Criteria: Flags tests that failed in at least 1 run and passed in at least 1 run.
-
Metrics: Total runs, failure count, pass count, and retry recovery rate.
-
CLI Command:
Terminal window npx zr history flaky
2. Regression Tracking (npx zr history regressions)
Section titled “2. Regression Tracking (npx zr history regressions)”Identifies test cases that passed in previous runs but regressed to Failed or Timed Out in the most recent run.
-
Value: Separates newly broken features from known broken or flaky tests.
-
CLI Command:
Terminal window npx zr history regressions
3. Slowest Tests Analysis (npx zr history slow)
Section titled “3. Slowest Tests Analysis (npx zr history slow)”Ranks top slowest test cases based on average duration across all recorded historical runs.
-
Limit Parameter: Support for custom top-N threshold output (
--limit N). -
CLI Command:
Terminal window npx zr history slow --limit 5
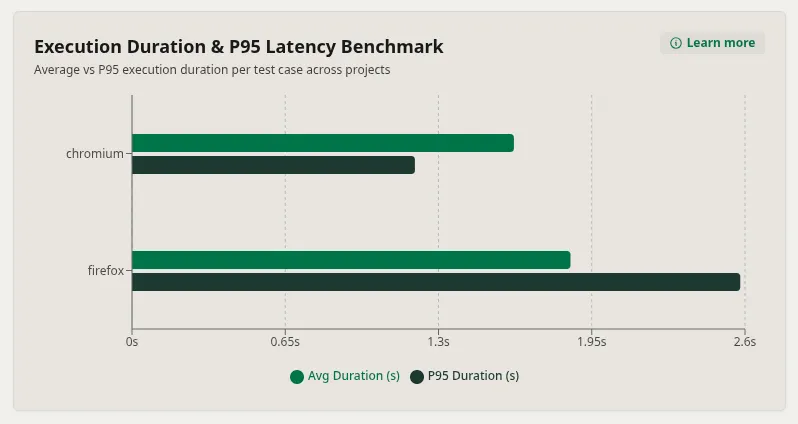
4. P95 Duration & Profile Latency
Section titled “4. P95 Duration & Profile Latency”Calculates the 95th percentile execution duration threshold across project profiles to highlight performance outliers.
💻 CLI Command Reference (zr history)
Section titled “💻 CLI Command Reference (zr history)”Note: History CLI commands require
@duckdb/node-apiinstalled as a devDependency in your project.
| Command | Description |
|---|---|
npx zr history |
List all historical test runs with start time, duration, and pass/fail/skip counts. |
npx zr history runs |
Same as npx zr history. Summarizes all recorded execution runs. |
npx zr history files |
Aggregate historical metrics grouped by spec file. |
npx zr history tests |
Granular execution metrics and average durations per test case. |
npx zr history flaky |
Identify flaky tests fluctuating between pass and fail. |
npx zr history regressions |
List tests that passed previously but failed in the latest run. |
npx zr history slow [--limit N] |
Rank top $N$ slowest tests by average execution duration across runs (default: 10). |
npx zr history trend |
Display historical pass rate percentages per run over time. |
npx zr history report |
Execute DuckDB aggregation over .jsonl runs and update history.json & index.html. |
npx zr history query "<SQL>" |
Execute arbitrary SQL queries directly over JSONL run records. |
🔍 Custom SQL Queries Interface (zr history query)
Section titled “🔍 Custom SQL Queries Interface (zr history query)”Tip: Use JSONL schema to construct your queries.
You can query your test execution logs directly using standard SQL via DuckDB:
Example 1: Find tests with average duration greater than 5 seconds
Section titled “Example 1: Find tests with average duration greater than 5 seconds”npx zr history query "SELECT title, file, AVG(duration_ms) / 1000 AS avg_sec FROM runs GROUP BY title, file HAVING avg_sec > 5 ORDER BY avg_sec DESC"Example 2: Count total failures per project profile across all runs
Section titled “Example 2: Count total failures per project profile across all runs”npx zr history query "SELECT project, COUNT(*) AS failure_count FROM runs WHERE status IN ('failed', 'timedOut') GROUP BY project ORDER BY failure_count DESC"