
Report Layout: Sticky Header & Sidebar Navigation
The Zen Reporter dashboard layout is structured around two key persistent components: the Sticky Header at the top and the Left Sidebar Navigation on the side. Together, they provide context, controls, and seamless navigation across all test execution views.
Part 1: Sticky Header & Global Navigation
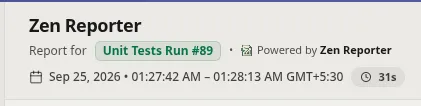
Section titled “Part 1: Sticky Header & Global Navigation”The Sticky Header (located at the top of the Zen Reporter dashboard) serves as the persistent command bar and metadata anchor for your test execution reports. Pinned permanently to the top of the browser viewport, it ensures your project name, test run name, timing metrics, and display customization controls are always accessible regardless of scroll depth.
| Header Left Side | Header Right Side |
|---|---|
 |
 |
🔍 Header Elements & Key Controls
Section titled “🔍 Header Elements & Key Controls”1. Project & Test Run Branding
Section titled “1. Project & Test Run Branding”- Project Name Title: Large bold heading presenting the top-level test project name (
projectName). Defaults to"Test Execution Report"if not configured. - Run Identifier Badge: Styled pill badge displaying the custom test run name (
testRunName), such as CI build numbers ("Build #42"), commit hashes, or release tags. - Zen Reporter Badge: Integrated Zen Reporter logo mark and brand attribution.
2. Execution Time & Duration Summary
Section titled “2. Execution Time & Duration Summary”Located below the project title, the header provides instant timing metrics for the run:
-
Date & Time Range: Displays the start and end timestamp of the test execution.
-
Wall-Clock Duration Pill: Highlighting total real-world execution duration calculated as:
Wall-Clock Duration =
End Time - Start TimeFormatted concisely as hours, minutes, and seconds (e.g.,
12m 45s).
3. Interactive Theme Selector Dropdown
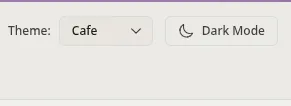
Section titled “3. Interactive Theme Selector Dropdown”Enables instant, real-time switching of the report’s visual design palette without reloading the page or losing current tab state:
Cafe(Default): Warm beige and espresso palette designed for low eye strain.Concept: Minimalist slate and indigo palette tailored for modern software interfaces.Sentinel: High-contrast navy and warning-color scheme, specifically engineered for maximum visibility.
4. One-Click Light / Dark Mode Toggle
Section titled “4. One-Click Light / Dark Mode Toggle”A responsive icon button allowing users to switch between Light Mode and Dark Mode dynamically:
- Sun / Moon Indicators: Displays a sun icon when in Dark Mode (switching to Light) and a moon icon when in Light Mode (switching to Dark).
⚙️ Header Configuration in playwright.config.{js/ts}
Section titled “⚙️ Header Configuration in playwright.config.{js/ts}”Header metadata and initial theme settings can be pre-configured directly in your Playwright configuration file:
import { defineConfig } from "@playwright/test";
export default defineConfig({  reporter: [    [      "@arpanp/zen-reporter",      {        projectName: "E2E Web Suite", // Displayed as main header title        testRunName: "Release v2.4.0", // Displayed in accent badge        theme: "Concept", // 'Cafe' | 'Concept' | 'Sentinel'        darkMode: true, // Set initial mode preference      },    ],  ],});
💡 Key Benefits of the Sticky Header
Section titled “💡 Key Benefits of the Sticky Header”- Persistent Execution Context: When analyzing long failure stack traces or scrolling through hundreds of test specs, engineers never lose context of which project build or timestamp they are inspecting.
- Instant Visual Customization: Switch between Dark Mode or change visual themes immediately from any tab or scroll position.
- Zero-Scroll Context Switching: Quick diagnostic confirmation of total run duration and completion timestamp available at a glance.
Part 2: Left Sidebar Navigation & Workspace Control
Section titled “Part 2: Left Sidebar Navigation & Workspace Control”The Left Sidebar serves as the primary navigation control center for Zen Reporter dashboards. Pinned to the left side of the screen, it allows QA engineers, developers, and managers to seamlessly toggle between high-level executive metrics, detailed test suite hierarchies, root cause failure traces, and historical analytics.
📐 Sidebar Layout & Viewport Modes
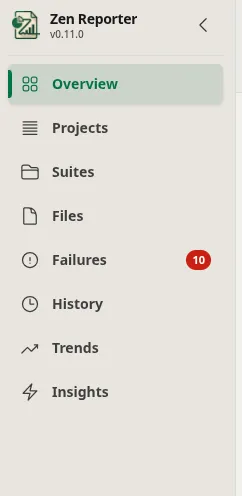
Section titled “📐 Sidebar Layout & Viewport Modes”The sidebar operates in two interactive width modes with smooth transitions:
| Sidebar Expanded (default) | Sidebar Collapsed |
|---|---|
 |
 |
- Expanded Mode: Displays full tab icons, text labels, failure count badges, and history status badges.
- Collapsed Mode: Collapses into an icon-only vertical bar for maximum horizontal dashboard screen real estate. Hovering over icons provides descriptive tooltips.
🧭 Navigation Tabs Overview
Section titled “🧭 Navigation Tabs Overview”The sidebar provides access to 8 core views of your test execution setup:
| Tab Icon & Name | View Description | Key Functionality |
|---|---|---|
Overview |
High-Level Executive Dashboard | Run metadata, quick KPI stats, radial pass rate ring, wall-clock duration efficiency, and test stability/flakiness metrics. |
Projects |
Per-Project Multi-Browser Analytics | Pass rate breakdown across Playwright project configurations (chromium, firefox, mobile), and test volume & coverage per project. |
Suites |
Interactive Suite & Spec Explorer | Expandable describe tree structure, full-text search, spec file result summaries, and retry badges. |
Files |
Spec File Metrics & Stability | Spec file health matrix, test counts, execution duration, and stability ratings. |
Failures |
Deep-Dive Root Cause Failure Analysis | Error signatures, step trace highlights (▶), code frame snippets, and expected vs. received diffs. |
History |
Execution Run Archive Log | Historical execution log, run-over-run quality ratings (Excellent, Critical), and wall-clock trends. |
Trends |
Long-Term Execution Metrics | Pass rate stability trends, wall-clock trajectory across projects, and test step categories composition. |
Insights |
DuckDB Embedded Intelligence | Flaky test detection, regression analysis, top slowest test cases, and P95 latency thresholds. |
🔔 Dynamic Badges & Indicators
Section titled “🔔 Dynamic Badges & Indicators”1. Failure Counter Badge
Section titled “1. Failure Counter Badge”The Failures tab features an automated real-time issue badge summarizing total execution anomalies calculated as:
Issue Count =
Failed Tests + Timed Out Tests + Interrupted Tests

- Expanded Mode: Displays a solid red badge on the right edge of the tab with the total count (e.g.,
10). - Collapsed Mode: Displays a compact red notification dot pinned to the top-right corner of the warning icon.
2. History Disabled Indicator
Section titled “2. History Disabled Indicator”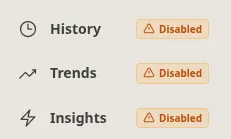
When historical run archiving is disabled in configuration (enableHistory: false), historical analytics tabs (History, Trends, and Insights) display warning badges:
- Expanded Mode: Renders an amber pill badge labeled
Disabledwith a warning icon. - Collapsed Mode: Displays an amber exclamation mark badge (
!) over the respective tab icons. - Indicative Warning: Clicking any disabled history tab shows a warning message at the top of the tab; indicating the need to enable history archiving in
playwright.config.tsin order to track historical data.

⚙️ Special Report Modes & Filtering
Section titled “⚙️ Special Report Modes & Filtering”1. Minimal Report Mode (minimalReport: true)
Section titled “1. Minimal Report Mode (minimalReport: true)”When generating lightweight static reports (minimalReport: true), Zen Reporter automatically streamlines the sidebar by removing heavy analytical tabs:
- Visible Tabs (4):
Overview,Suites,Files,Failures. - Hidden Tabs (4):
Projects,History,Trends,Insights.
2. Executive Summary Mode (summary.html)
Section titled “2. Executive Summary Mode (summary.html)”When rendering the standalone executive summary view (summary.html or ?view=summary), the sidebar is completely suppressed to present a zero-distraction summary interface.
🛠️ Sidebar Configuration in playwright.config.ts
Section titled “🛠️ Sidebar Configuration in playwright.config.ts”Control history recording and minimal reporting modes directly in your configuration:
import { defineConfig } from "@playwright/test";
export default defineConfig({  reporter: [    [      "@arpanp/zen-reporter",      {        enableHistory: true, // Set to false to disable history & show warning badges        minimalReport: false, // Set to true to filter sidebar to essential tabs only      },    ],  ],});
💡 Benefits & Ergonomics of Sidebar Navigation
Section titled “💡 Benefits & Ergonomics of Sidebar Navigation”- Active State Highlight: Current tab is highlighted with an inset blue indicator bar along the left edge and background tinting for instant visual feedback.
- Keyboard & Tooltip Friendly: Full ARIA tooltip support in collapsed mode ensures screen readers and keyboard navigation remain accessible.
- Zero-Reload Tab Switching: All tab transitions are powered by React state, eliminating browser page reloads when switching between views.