
Per-Project Execution Analytics
Modern Playwright test suites frequently execute the same test files across multiple project profiles (e.g., Desktop Chrome, Desktop Firefox, Mobile Safari, API Testing). The Projects tab in Zen Reporter isolates and compares metrics across each configured Playwright project.
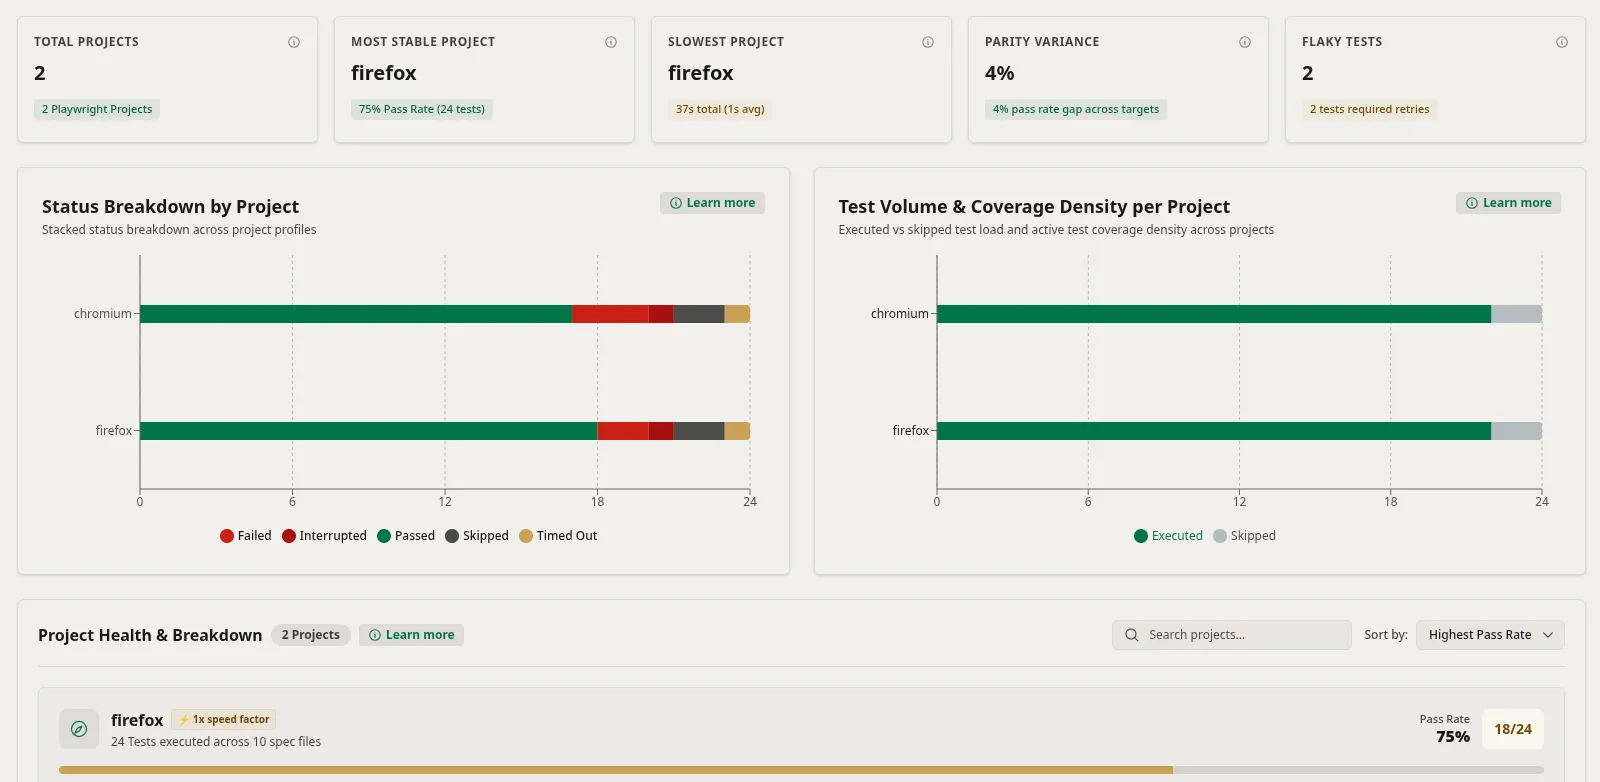
📊 Projects Tab Overview
Section titled “📊 Projects Tab Overview”┌────────────────────────────────────────────────────────────────────────┐│ Per-Project Analytics │├────────────────────────────────────────────────────────────────────────┤│ Project Breakdown Summary ││ Total Projects, Most Stable Project, Slowest Project, ││ Pass Rate Parity Variance, Total Flaky Tests │├────────────────────────────────────────────────────────────────────────┤│ Status Distribution Chart ││ Stacked / Grouped Bar Charts of Passed/Failed/Skipped/ ││ Interrupted/Timed out per Project │├────────────────────────────────────────────────────────────────────────┤│ Volume & Coverage Distribution Chart ││ Comparison of Test Counts and Wall-Clock Durations ││ per Project Profile │├────────────────────────────────────────────────────────────────────────┤│ Project Detail Cards ││ Detailed Breakdown Cards per Project Profile ││ with Pass Rate & Duration │└────────────────────────────────────────────────────────────────────────┘🔍 Key Analytics & Visualizations
Section titled “🔍 Key Analytics & Visualizations”1. Project Summary Cards
Section titled “1. Project Summary Cards”High-level summary metrics at the top of the Projects view:
- Total Projects: Total number of Playwright project targets executed in the run.
- Most Stable Project: Identifies the project target achieving the highest pass rate percentage.
- Slowest Project: Highlights the project profile taking the longest cumulative execution time.
- Parity Variance: Measures the pass rate gap percentage across targets to spot cross-browser or cross-environment instability.
- Total Flaky Tests: Tracks the total number of test cases across project targets that required retries to pass.
2. Status Distribution Chart
Section titled “2. Status Distribution Chart”- Interactive Bar Chart: Visualizes the distribution of test statuses (
Passed,Failed,Timed Out,Skipped,Interrupted) per project profile. - Hover Insights: Hovering over any bar displays exact test counts for that specific browser profile.
- Multi-Browser Comparison: Easily spot issues specific to a single engine (e.g., tests failing only on
webkit/ Mobile Safari).
3. Volume & Coverage Distribution
Section titled “3. Volume & Coverage Distribution”- Volume vs. Duration: Plots both test case count and cumulative execution duration for each project.
- Bottleneck Identification: Identifies browser profiles taking disproportionately longer execution times despite having identical test counts.
4. Project Detail Cards
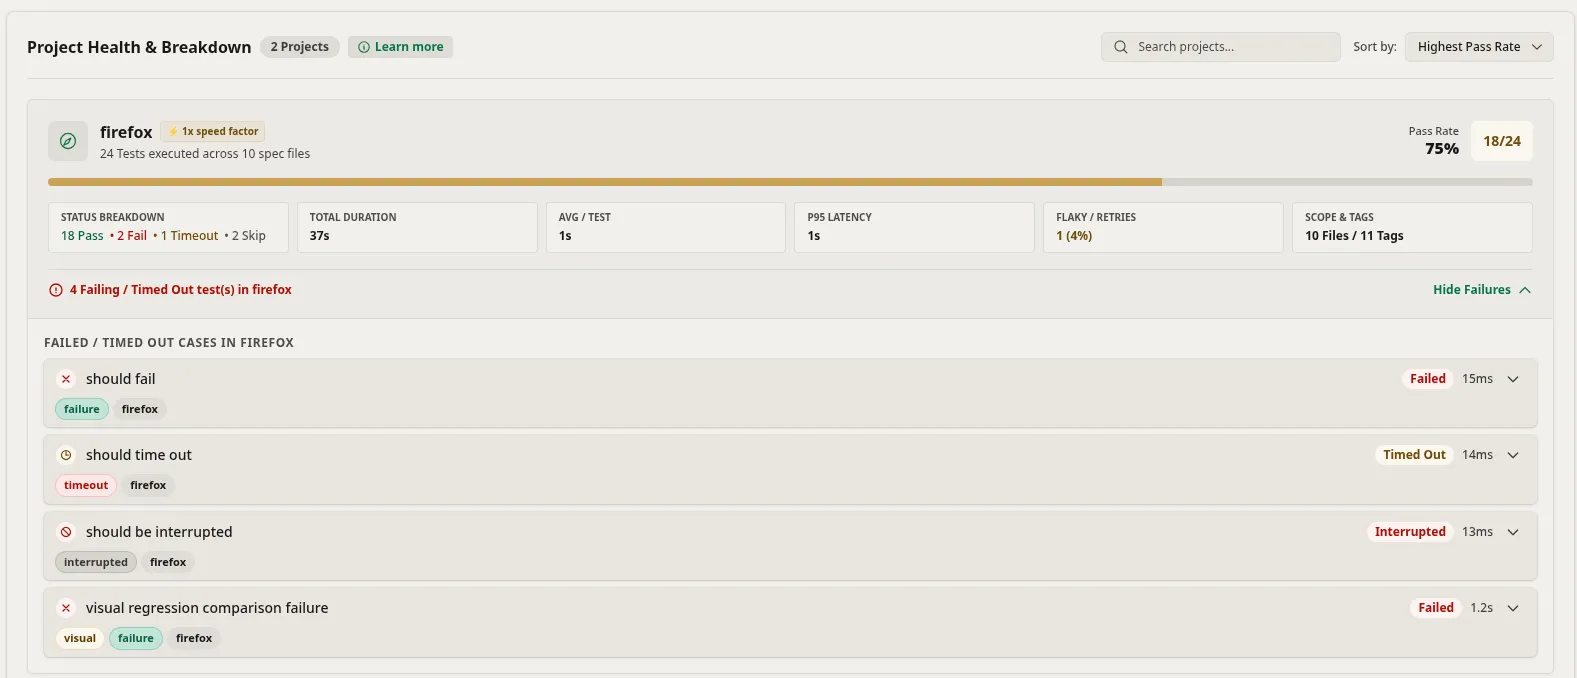
Section titled “4. Project Detail Cards”Comprehensive standalone cards for every Playwright project profile under the Project Health & Breakdown view:
- Search & Sort Controls: Filter project cards by name via the search input or sort them using metrics such as Highest Pass Rate.
- Project Header & Pass Rate Progress Bar: Displays project profile name, speed factor badge, total tests executed across spec files, and pass rate percentage badge with a color-coded visual progress bar.
- Metrics Grid: Standardized metric breakdown cards for each project:
- Status Breakdown: Color-coded counts of Passed, Failed, Timed Out, and Skipped tests.
- Total & Average Duration: Total execution duration and average runtime per test case.
- P95 Latency: 95th percentile latency benchmark.
- Flaky / Retries: Count and percentage of tests requiring retries to pass.
- Scope & Tags: Total spec files and distinct tags associated with the project.
- Inline Collapsible Failure Breakdown: Expandable list displaying failing, timed out, and interrupted test cases per project with status tags, execution runtimes, and direct inspection options.
💡 Practical Use Cases
Section titled “💡 Practical Use Cases”- Cross-Browser Compatibility Testing: Instantly isolate whether a failure is an application bug (failing across Chromium, Firefox, and Webkit) or a browser-specific visual engine glitch (failing only on Webkit).
- Mobile Viewport Analysis: Compare desktop execution metrics against mobile responsive viewport profiles (
Mobile Chrome,iPhone 13). - Parallel Worker Optimization: Identify heavy projects that stall overall CI execution time and move them to dedicated worker pools.