
Suite & Spec File Explorer
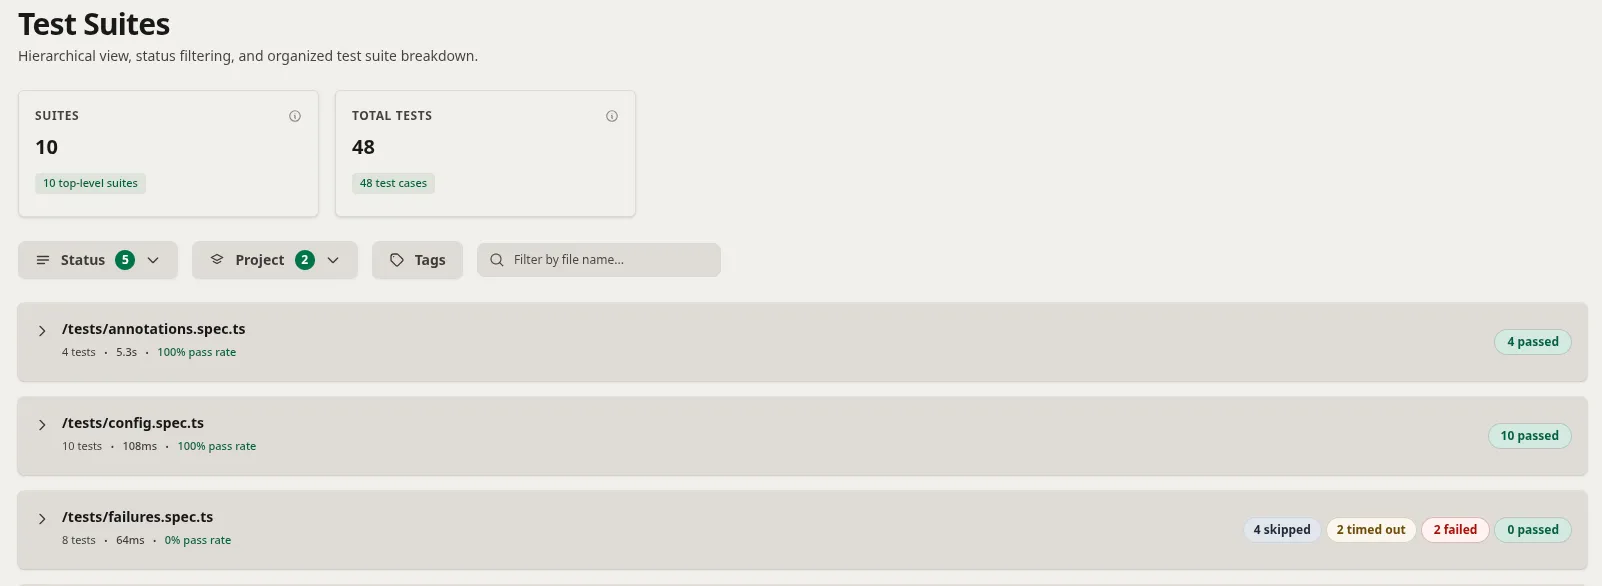
Viewing test results of a large test suites with hundreds of describe blocks and spec files can be overwhelming. Zen Reporter provides two dedicated explorer views: Suites (interactive tree view) and Files (paginated spec file metrics table).
🌳 Interactive Suite Tree (Suites Tab)
Section titled “🌳 Interactive Suite Tree (Suites Tab)”The Suites tab presents raw nested Playwright test.describe() groups into a collapsible hierarchy tree view.
📁 e2e/auth/login.spec.ts ├── 📁 describe("Authentication Workflow") │ ├── 🟢 test("User can login with valid credentials") [Passed - 1.2s] │ └── 🔴 test("Invalid password displays error message") [Failed - 3.4s] [Retry #1] └── 📁 describe("OAuth Providers") └── 🟢 test("Google SSO redirect") [Passed - 850ms]Key Features of Suite View
Section titled “Key Features of Suite View”- Nested Describe Collapsibility: Infinite nesting support for
test.describe()groups with interactive collapse/expand toggle controls. - Bulk Expand / Collapse Controls: Header buttons to expand all nodes or collapse all nodes in a single click.
- Full-Text Live Search Filter: Filter the entire suite tree by execution status, project name, tag (e.g.,
@smoke,@regression), or spec file name. - Retry Attempt Badges: Clearly labels test cases that required retries to pass, displaying retry counts and attempt history.
- Status & Duration Indicators: Color-coded icons (🟢 Passed, 🔴 Failed, 🟡 Timed Out, 🔴 Interrupted, ⚪ Skipped) with precise execution duration tags for each test case.
- Inline Test Case Cards: Click on any test node to open detailed execution metrics, console logs, and step execution details.
- Attachment Previews & Quick Downloads: Interactive attachment modal supporting in-app previews for text logs, failure screenshots, and execution video recordings, along with one-click quick downloads for Playwright
.ziptrace files.
📄 Spec Files View (Files Tab)
Section titled “📄 Spec Files View (Files Tab)”The Files tab aggregates test execution metrics at the spec file level, giving QA managers and engineers a file-by-file breakdown of suite health, execution density, and duration ranking.
1. Top Summary KPI Cards
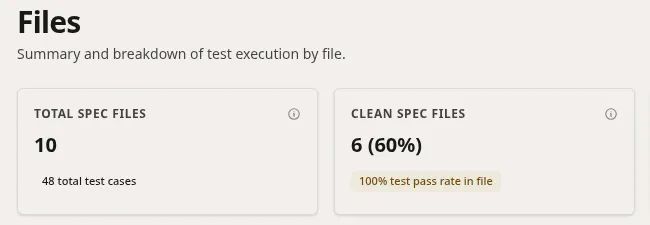
Section titled “1. Top Summary KPI Cards”A top horizontal bar summarizing overall spec file statistics:
- Total Spec Files: Count of all evaluated spec files (e.g.,
10files containing48 total test cases). - Clean Spec Files: Proportion of spec files with a 100% pass rate (e.g.,
6 (60%)with a100% test pass rate in filebadge). - Failing Spec Files: Count of spec files containing test errors (e.g.,
4with a40% of files have errorsbadge). - Files with Retries: Count of spec files requiring test retries to complete (e.g.,
1with a10% of files required retriesbadge). - Failure Concentration: Percentage ratio of failure concentration pointing to the top failing spec file (e.g.,
40%concentrated in/tests/failures.spec.ts).
2. File Density & Duration Benchmarks
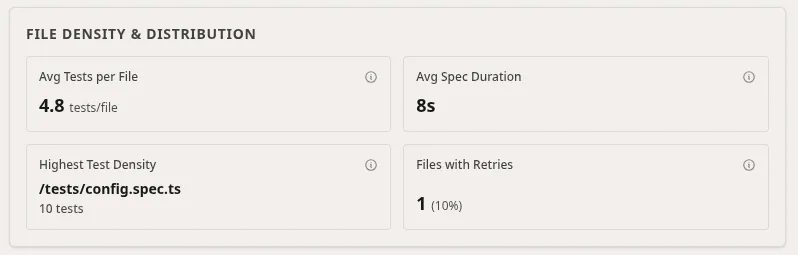
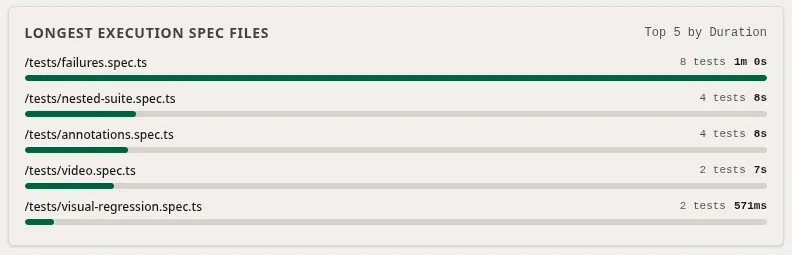
Section titled “2. File Density & Duration Benchmarks”Two side-by-side analytical cards providing execution distribution metrics:
- File Density & Distribution Card:
- Avg Tests per File: Average number of test cases contained per spec file (e.g.,
4.8 tests/file). - Avg Spec Duration: Average wall-clock execution duration per spec file (e.g.,
7s). - Highest Test Density: Identifies the spec file containing the most test cases (e.g.,
/tests/config.spec.tswith10 tests). - Files with Retries: Count and percentage of files executing retries (e.g.,
1 (10%)).
- Avg Tests per File: Average number of test cases contained per spec file (e.g.,
- Longest Execution Spec Files Card:
- Ranks the Top 5 Spec Files by Duration with visual progress bars indicating test count and wall-clock execution time (e.g.,
/tests/failures.spec.ts-8 tests, 1m 0s).
- Ranks the Top 5 Spec Files by Duration with visual progress bars indicating test count and wall-clock execution time (e.g.,
3. File Breakdown Summary Table
Section titled “3. File Breakdown Summary Table”A comprehensive paginated breakdown table (File Breakdown Summary):
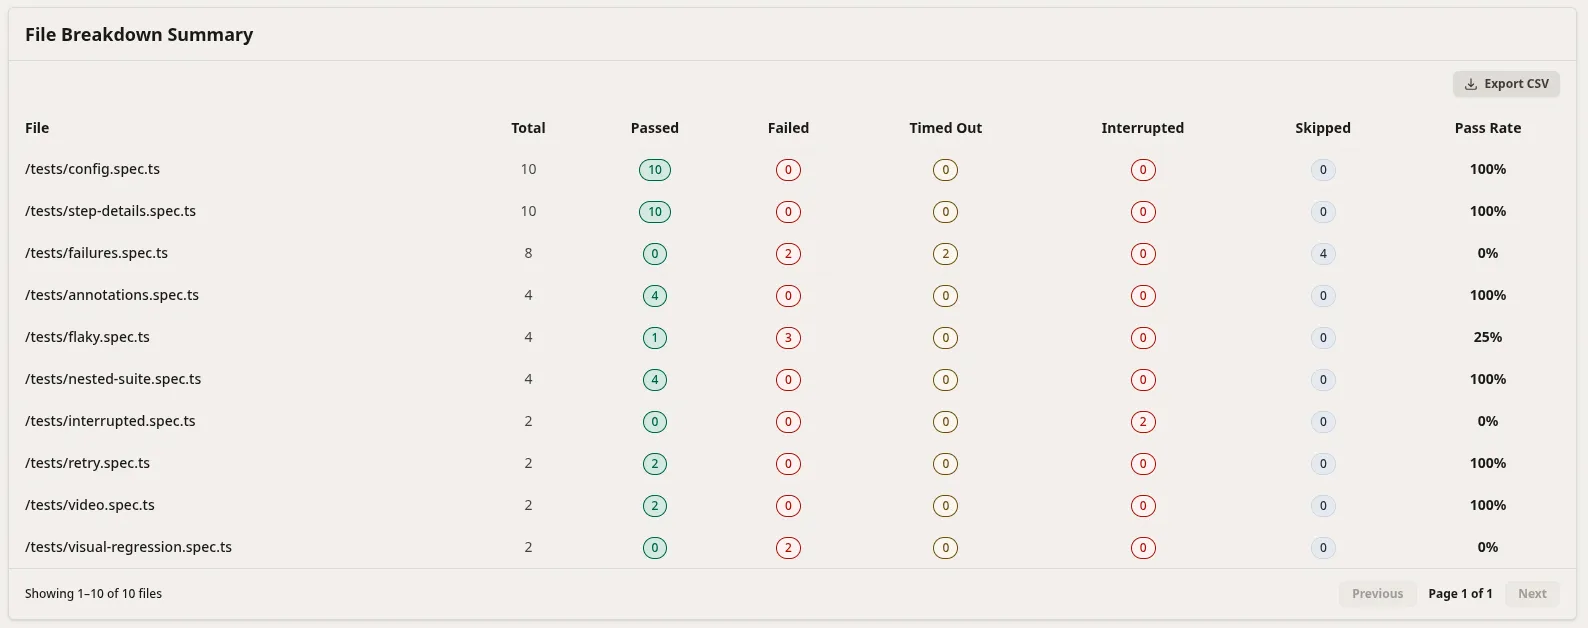
- Pill Badges: Color-coded pill counters for Passed (green), Failed (red), Timed Out (yellow), Interrupted (red), and Skipped (blue) case counts.
- Export to CSV: Includes an explicit Export CSV button to export the full file breakdown dataset into CSV format.
💡 Best Practices
Section titled “💡 Best Practices”- Tag Filtering: Use Playwright test tags (
@smoke,@critical,@flaky) in your test titles. Type@smokeinto the search filter to instantly filter the tree view down to your target test suite. - Isolating Failure Hotspots: Review the Failure Concentration card and examine the File Breakdown Summary table to identify spec files with low Pass Rates that contribute most to build instability.
- Analyzing Duration Bottlenecks: Inspect the Longest Execution Spec Files card to identify top long-running spec files and optimize parallel worker allocation or split test cases.
- Inspecting Media & Trace Attachments: Open test case cards directly from the Suites tree to preview failure screenshots, watch video recordings, and download Playwright
.ziptrace files for deep offline debugging. - Exporting Metrics for BI & Reporting: Click Export CSV in the Files tab to generate CSV reports for offline archiving or integration with QA management dashboards.